Mohammad Ali Khan

I am a computer scientist who is passionate about web development and data visualisation. I graduated from the University of Southampton and now work as a Software Engineer at FactSet in London. I have a considerable amount of experience in web-related technologies across the full web stack by taking part in numerous web development projects over the years. Outside of development, I enjoy reading books, playing video games and watching football as well as playing it myself.
Education school
University of Southampton
Masters of Engineering - First Class Honours
- date_rangeSeptember 2011 to May 2015
- placeSouthampton, United Kingdom
- link Website
Experience business_center
FactSet Europe Ltd.
Software Engineer
- date_rangeAugust 2015
- placeLondon, United Kingdom
- link Website
PCs4Kids
Part-time Volunteer Full-Stack Web Developer
- date_rangeNovember 2017 to January 2019
- placeLondon, United Kingdom
- link Website
J.P. Morgan Chase & Co.
Technology Intern
- date_rangeJune 2014 to August 2014
- placeLondon, United Kingdom
- link Website
Micro Focus Ltd.
Product Development Intern
- date_rangeJune 2013 to August 2013
- placeNewbury, United Kingdom
- link Website
Skills build
Programming Languages
-
Java
-
C#
-
JavaScript
-
SQL
-
TypeScript
-
Python
Frameworks & other technologies
-
Git
-
Jenkins
-
Node.js
-
AngularJS
-
Twitter Bootstrap
-
React
Spoken Languages
-
English
-
Urdu
-
Hindi
Projects lightbulb_outline
- date_rangeMay 2020
- code GitHub
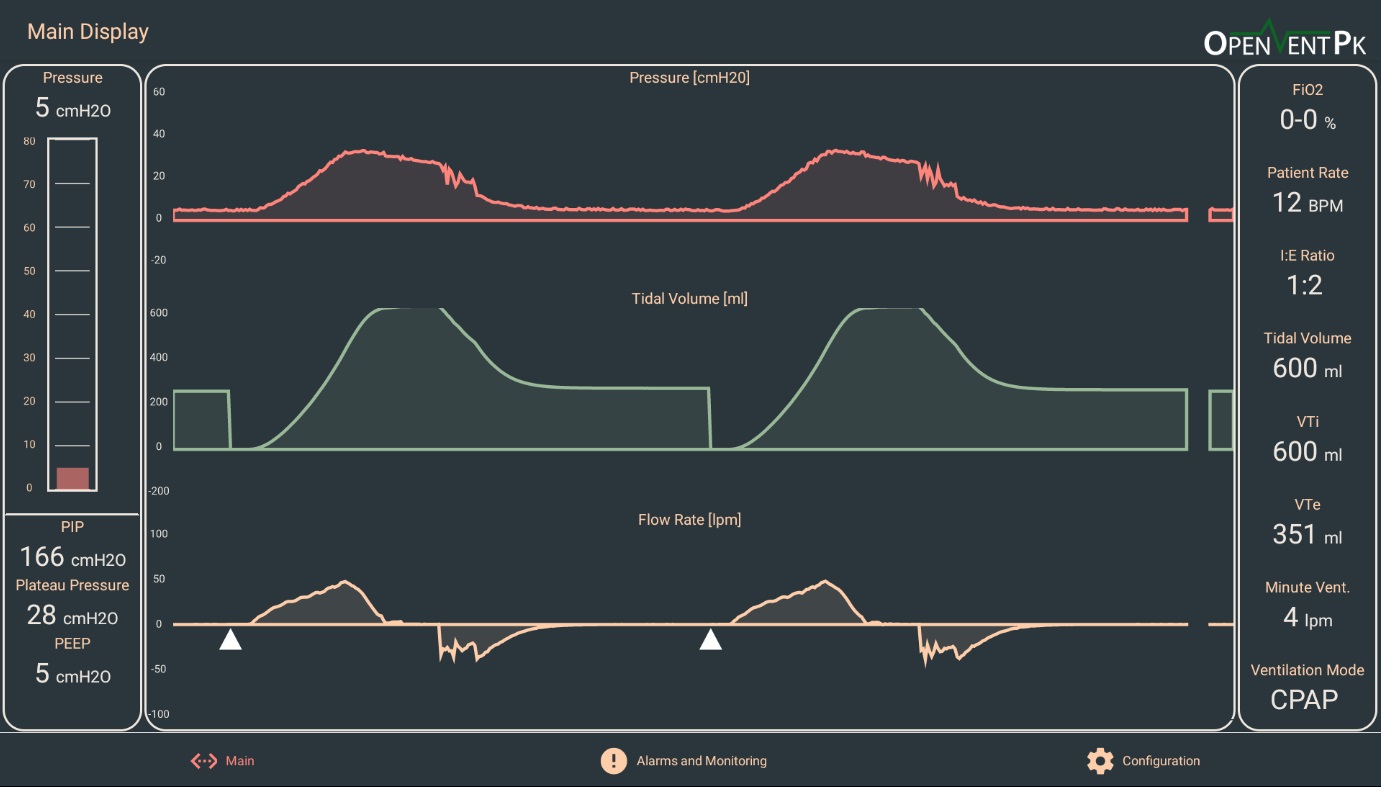
Lead work on Android application written in React Native to allow connecting to a ventilator via cable and show information about ventilation. This app also alarms based on certain problems.

One of the games created as an educational activity for kids. While another developer created this application, I converted it into a library which could be added to the main World application to be run from the overall interface. This involved restructuring the program and moving dependencies from being hard-coded to be downloaded via npm as well as being minified into UMD form.

This is a small library created to aid in other projects for the charity PCs4Kids. This allows the user of the library to provide images and coordinates and uses SnapSVG to create an interactive map.
- date_rangeMarch 2017
- code GitHub
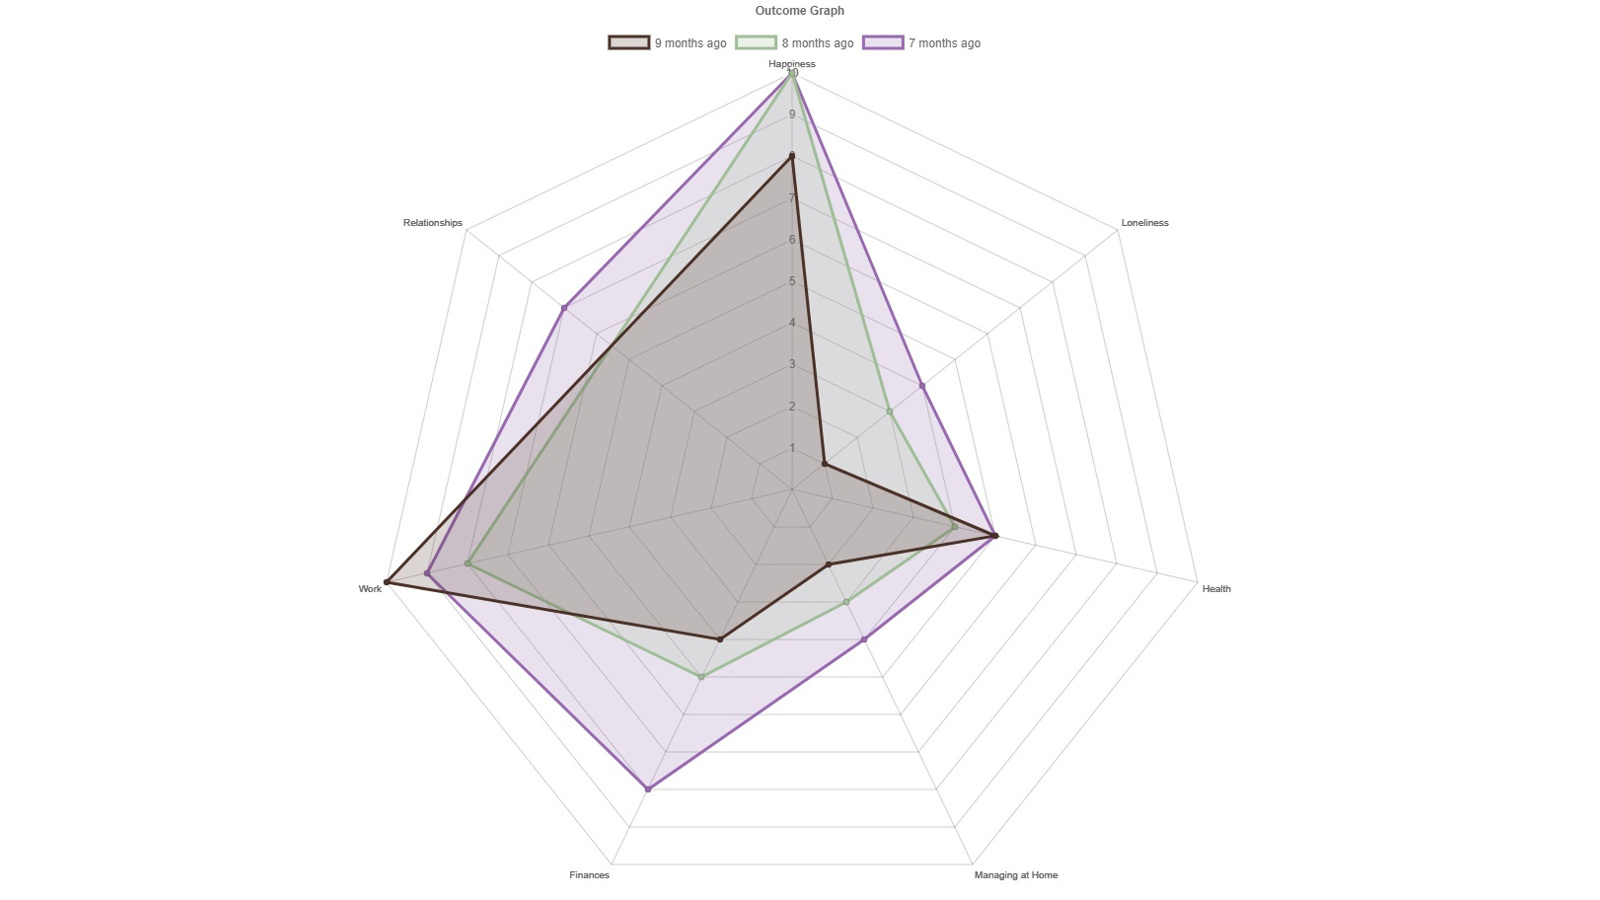
This is a small library which converts multiple sessions of Strength and Difficulties Questionnaires (SDQ) into a ChartJS compatible datasets to display a radar chart. It expects a certain strucutre and colours each session distintly different from the other ones. It can handle multiple sessions as well as numerous areas, all of which may not be present on each session.
- date_rangeAugust 2015
- code GitHub
- link Version 3.0
- link Version 2.0
- link Version 1.0
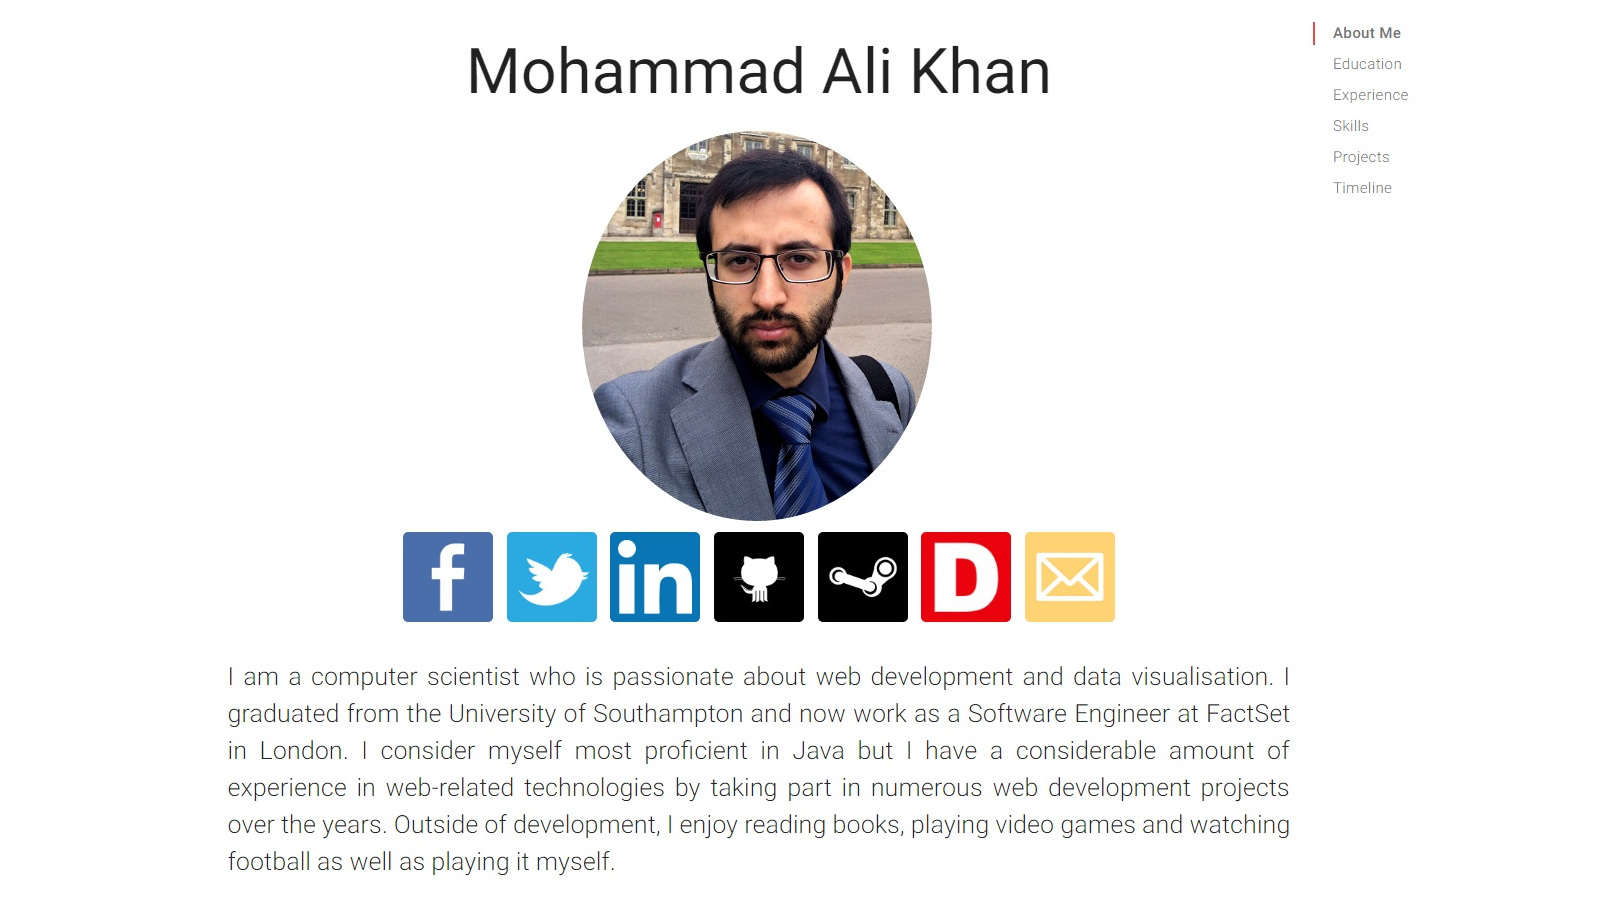
This webpage; the current website is version number 3. The initial version of this website was done in 2011, soon after starting university, using a website template and can be found here. That was then revamped in September of 2014, started from scratch and created using bootstrap, with a mobile-friendly version too. This has been worked on since the start of this year, changing the layout and framework behind it (twitter boostrap to material design materialize), as well as adding new features such as the timeline.
- date_rangeAugust 2015
- link Website
- insert_drive_file Project Report
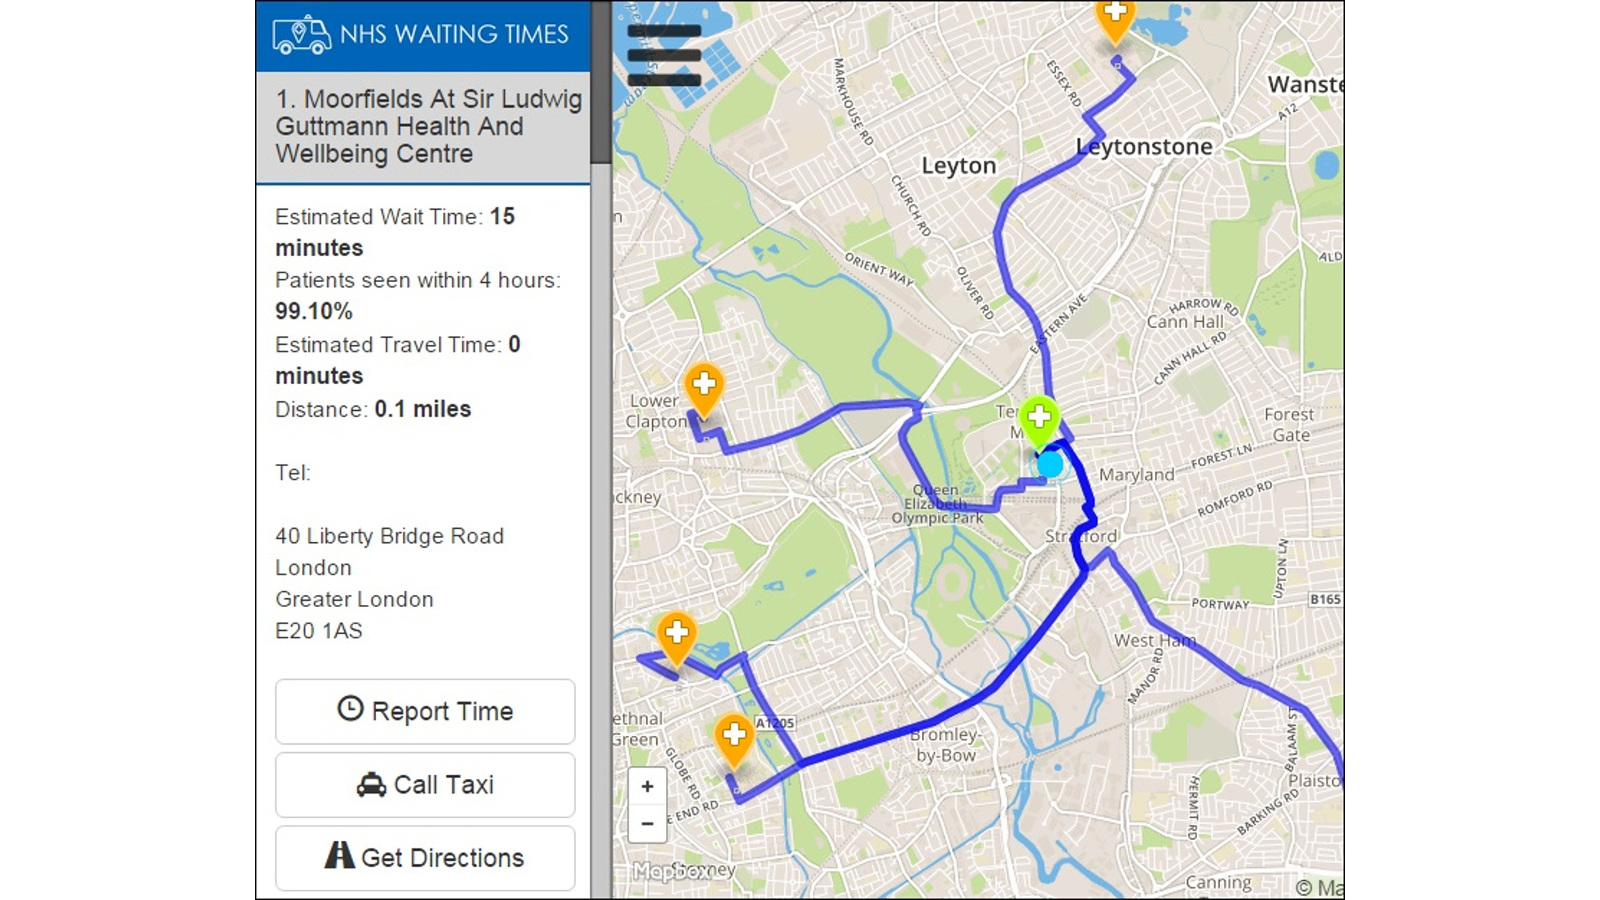
A group project application which, given a location, finds the closest hospitals with the least amount of waiting times for Accident and Emergency departments (A & E). It uses open data from the NHS in the form of percentage of patients seen in the first four hours as well as hospital ratings and combines this with OpenStreetMap to provide locations on the map. It can be used on the web or on a mobile phone just as easily.
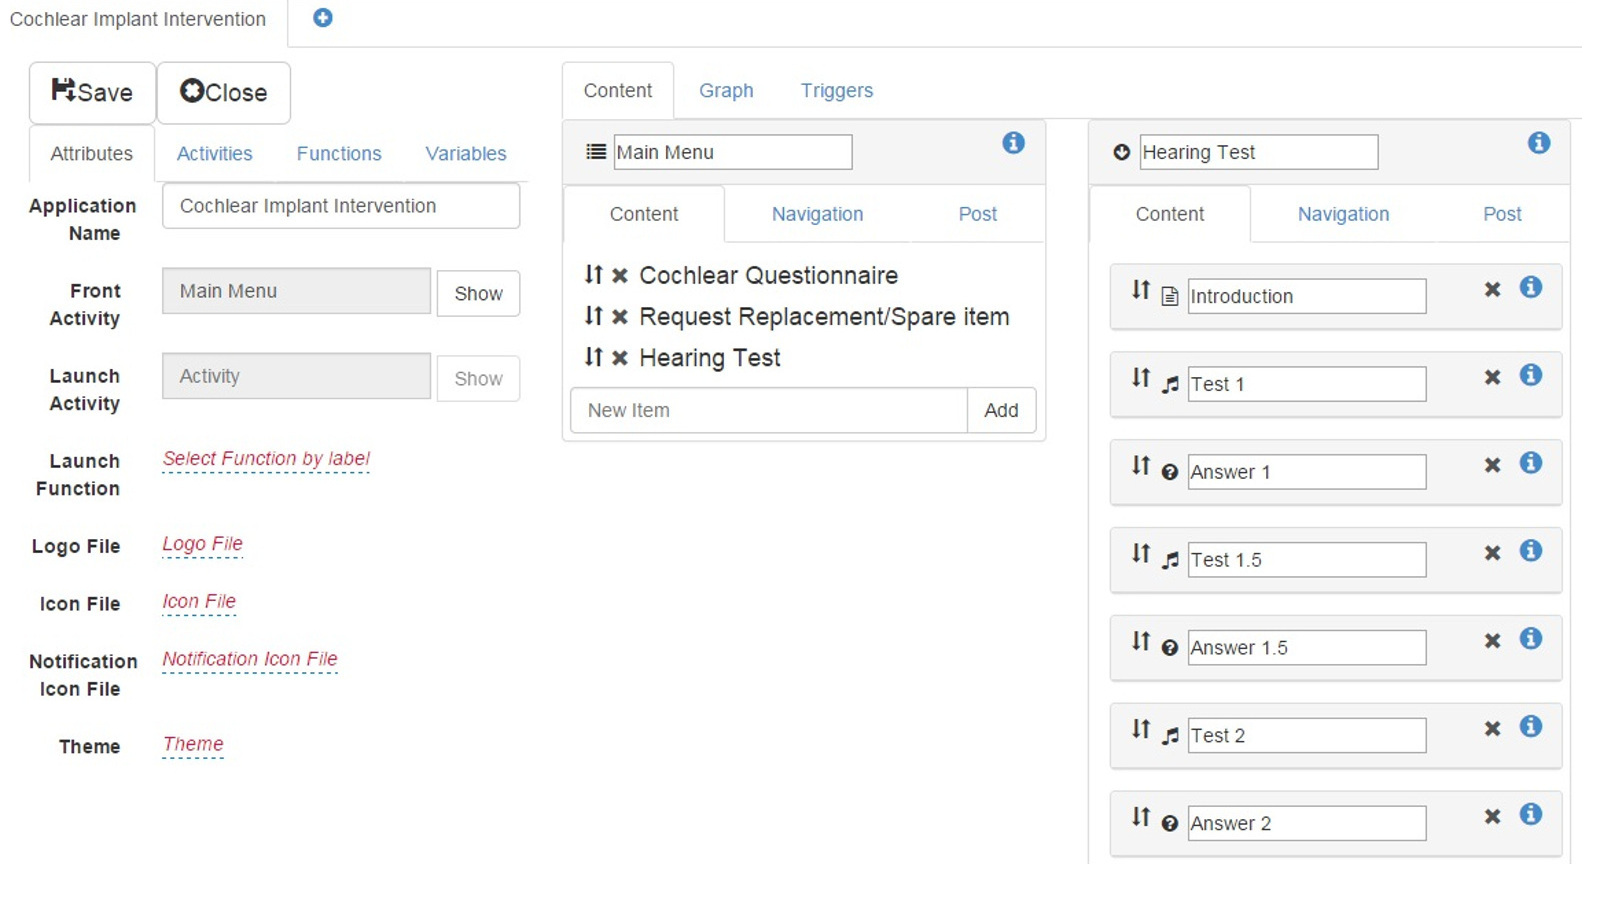
A group development project (GDP) improving and extending a mobile intervention editor to create an intervention for cochlear implant users so that they can do regular hearing check ups in the comfort of their homes. This project involved implementing features to add media files on the web-based intervention editor and functionality to play these media files on the intervention client application. Lastly, the intervention was created with numerous optimisations on the editor and run on the client application. The intervention editor was written mostly in CoffeeScript with BackboneJS and the client application was for Android devices.
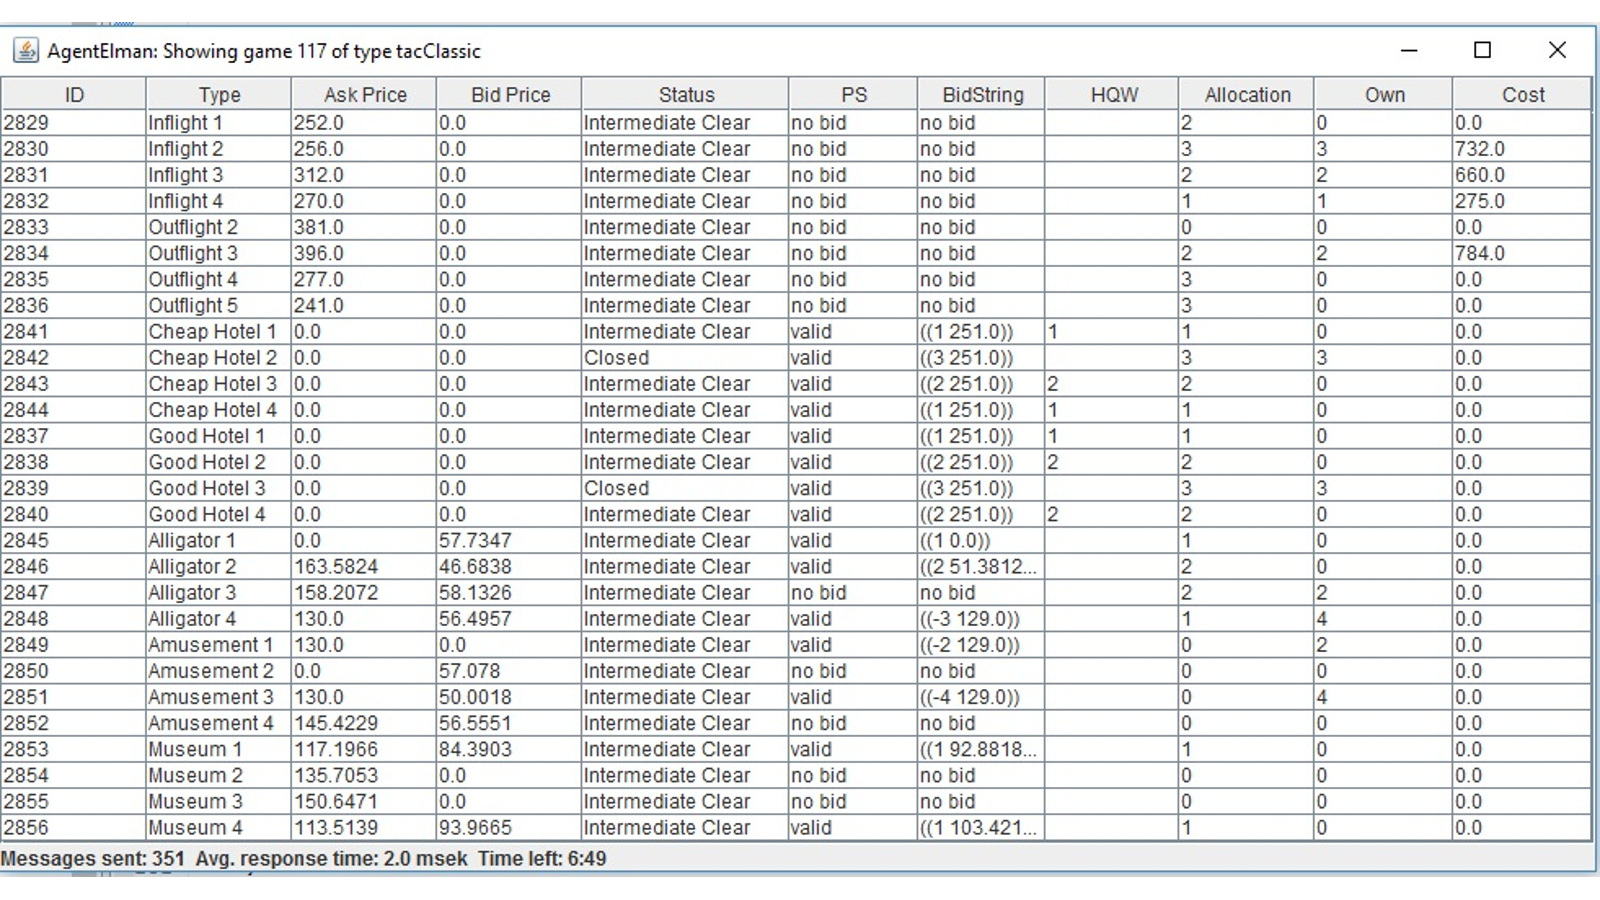
Group project to create an intelligent agent for participation in the Trading Agent Competition. In the competition, the agent competed with other agents to compose holiday packages for clients for the least amount of money. Numerous strategies were employed to make sure good packages could be created such as bidding low for unwanted tickets so that they might be used in potential packages. The agent finished a respectable 7th postion from around 25 agents competing.
- date_rangeAugust 2015
- code GitHub
- link Website
- insert_drive_file User Manual
- insert_drive_file Technical Documentation
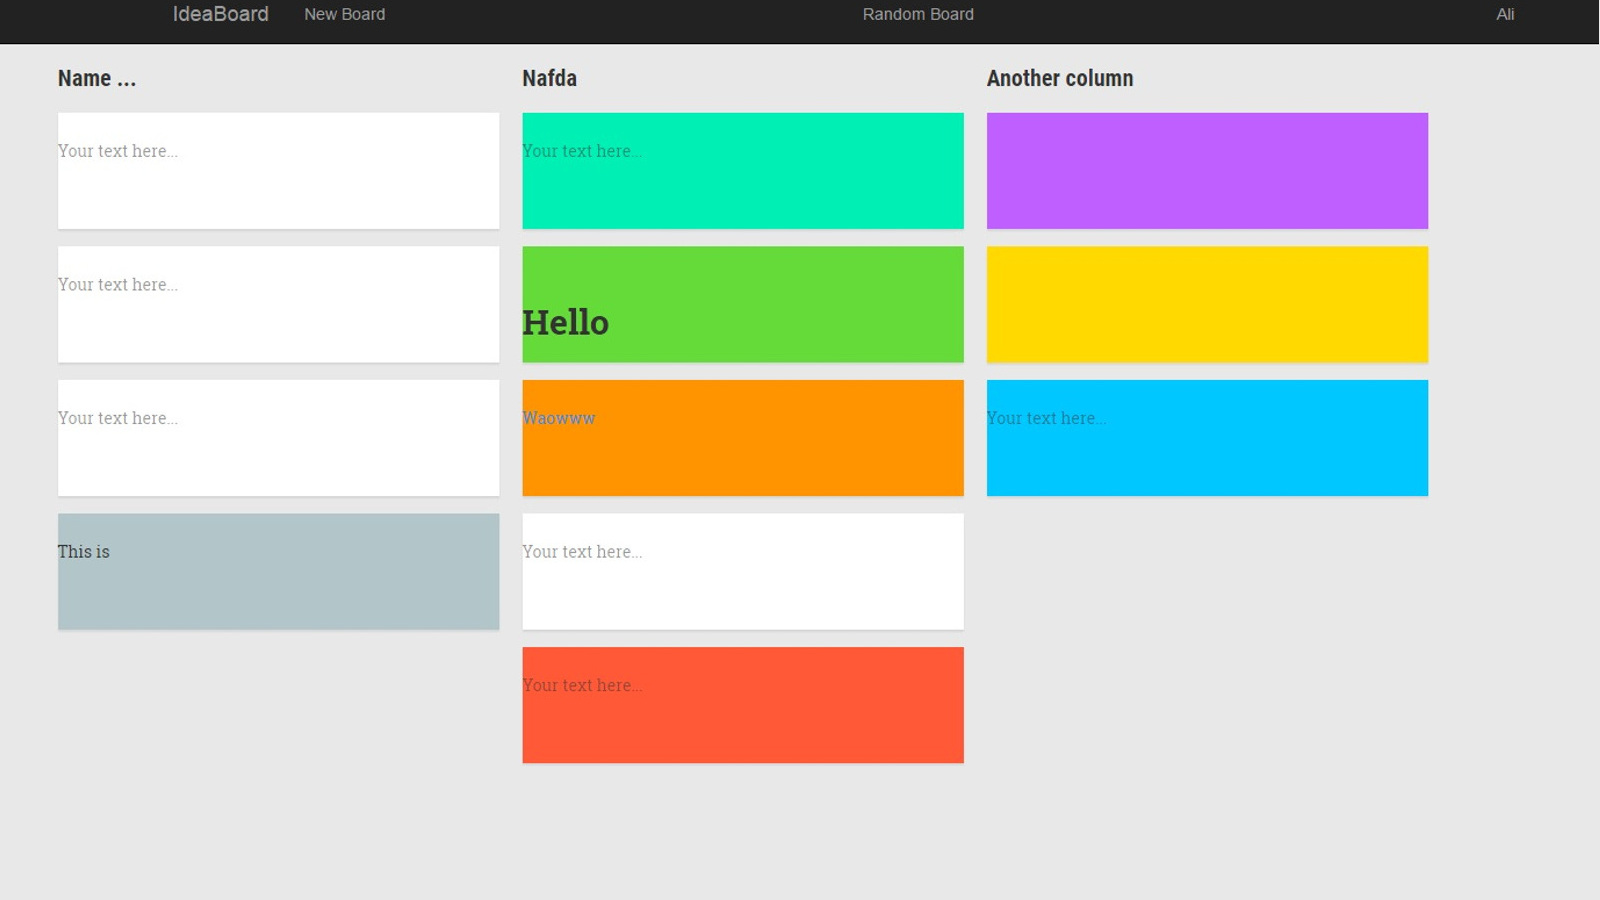
A group project to create a note-taking web applicaiton for a web development module. Attempted abstraction of the idea board model, a board where people stick a number of post-it notes on to help visualise their thoughts. This application allows people to create boards and have notes in a column of their choosing. The notes themselves can be customised in relation to text formatting and colour.
- date_rangeAugust 2015
- code GitHub
- link Website
- insert_drive_file Project Report
- link Demo Video (Zip)
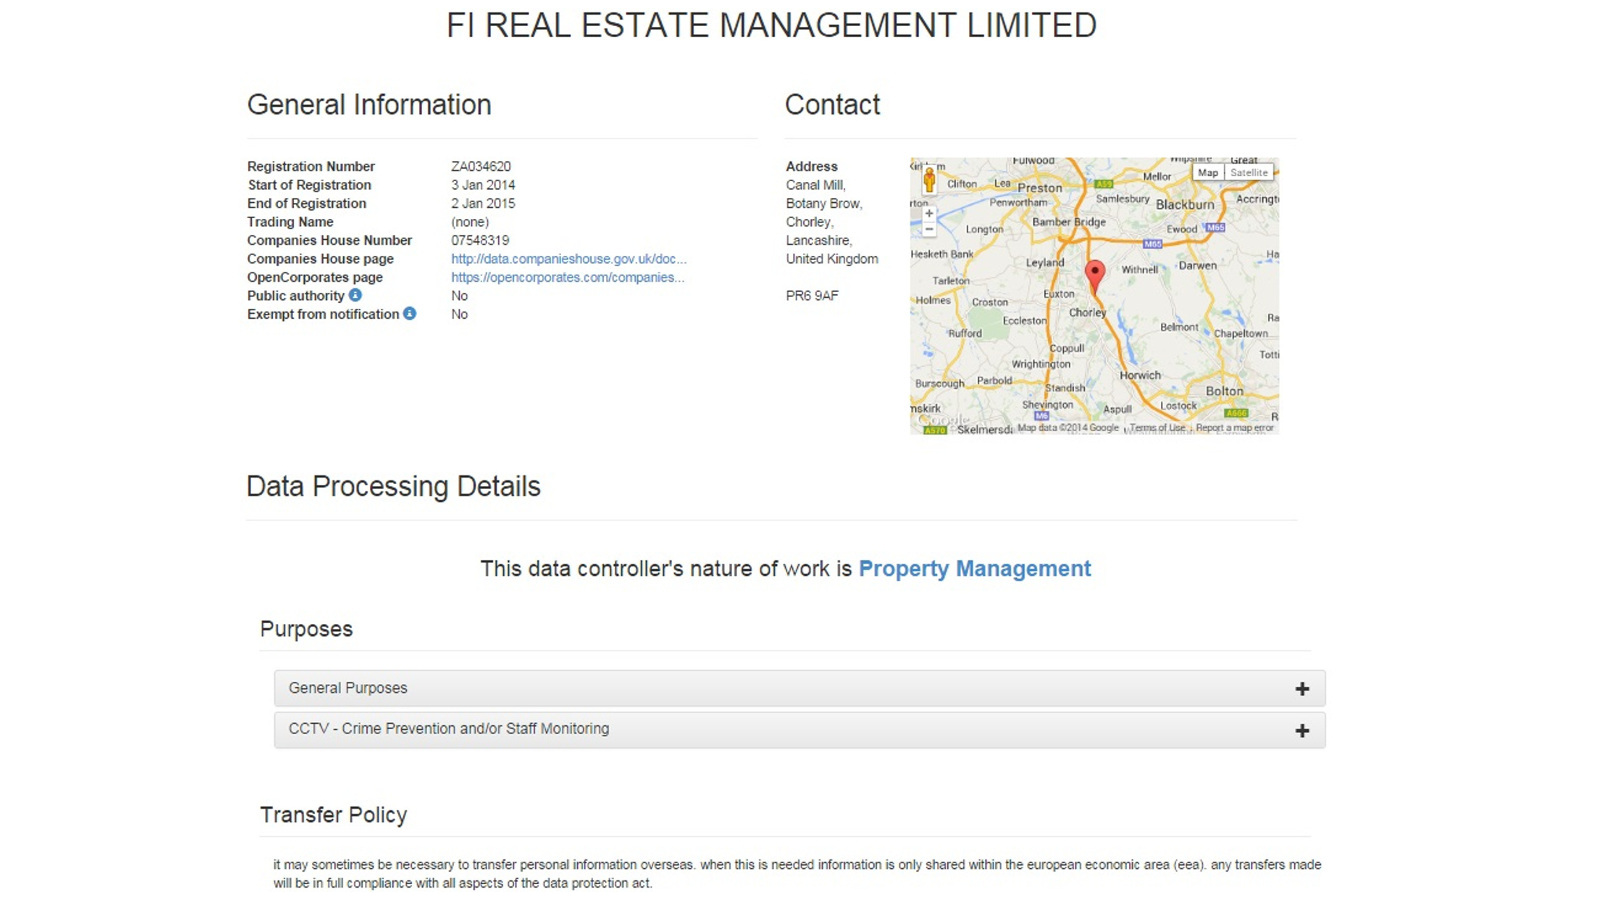
Individual project of an online resource showing the information companies in the United Kingdom store and share. Users can search for the desired companies and view the reasons for processing data, the data processed, whom it is processed from and whom it is shared with. There are also data visualisations provided, such as an overview of the information collected as compared to the general median/average. Moreover, users can view similar companies. This project is now deprecated.
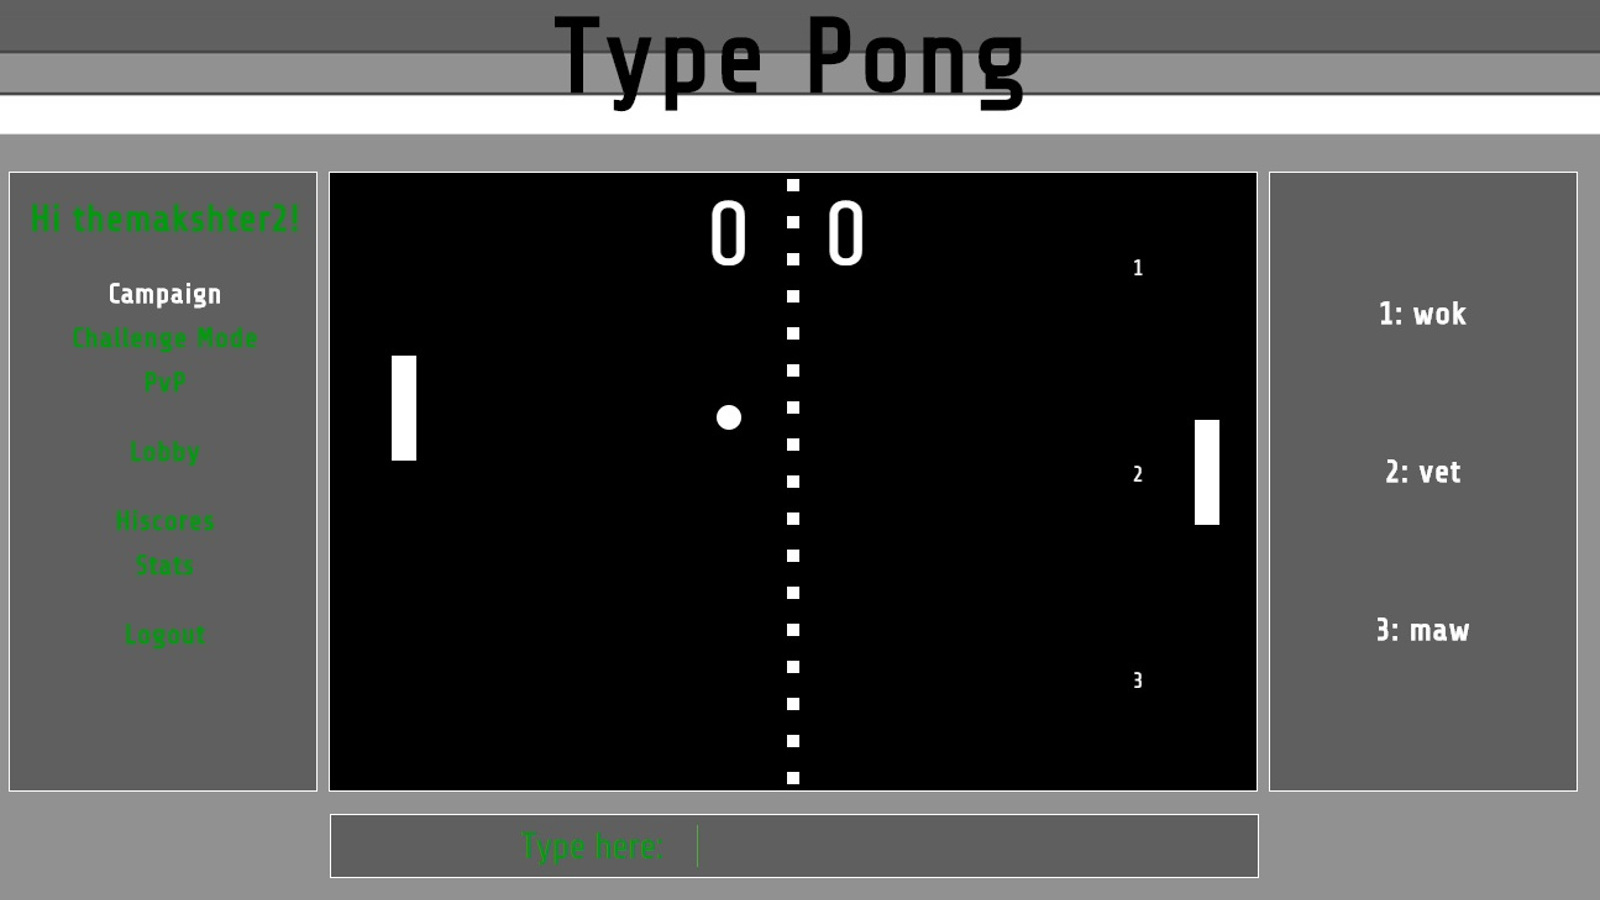
A group project web application aiming to improve typing speeds where users play pong while typing. Correctly typed words allow users to move the paddle to meet the ball. Users can play against the AI in levels, where AI gets better with levels, or in challenge mode, where the AI is perfect, never missing a balll and users try to last as long as possible. Users can also play against each other and view their high scores in these different game modes.
- date_rangeAugust 2015
- code GitHub
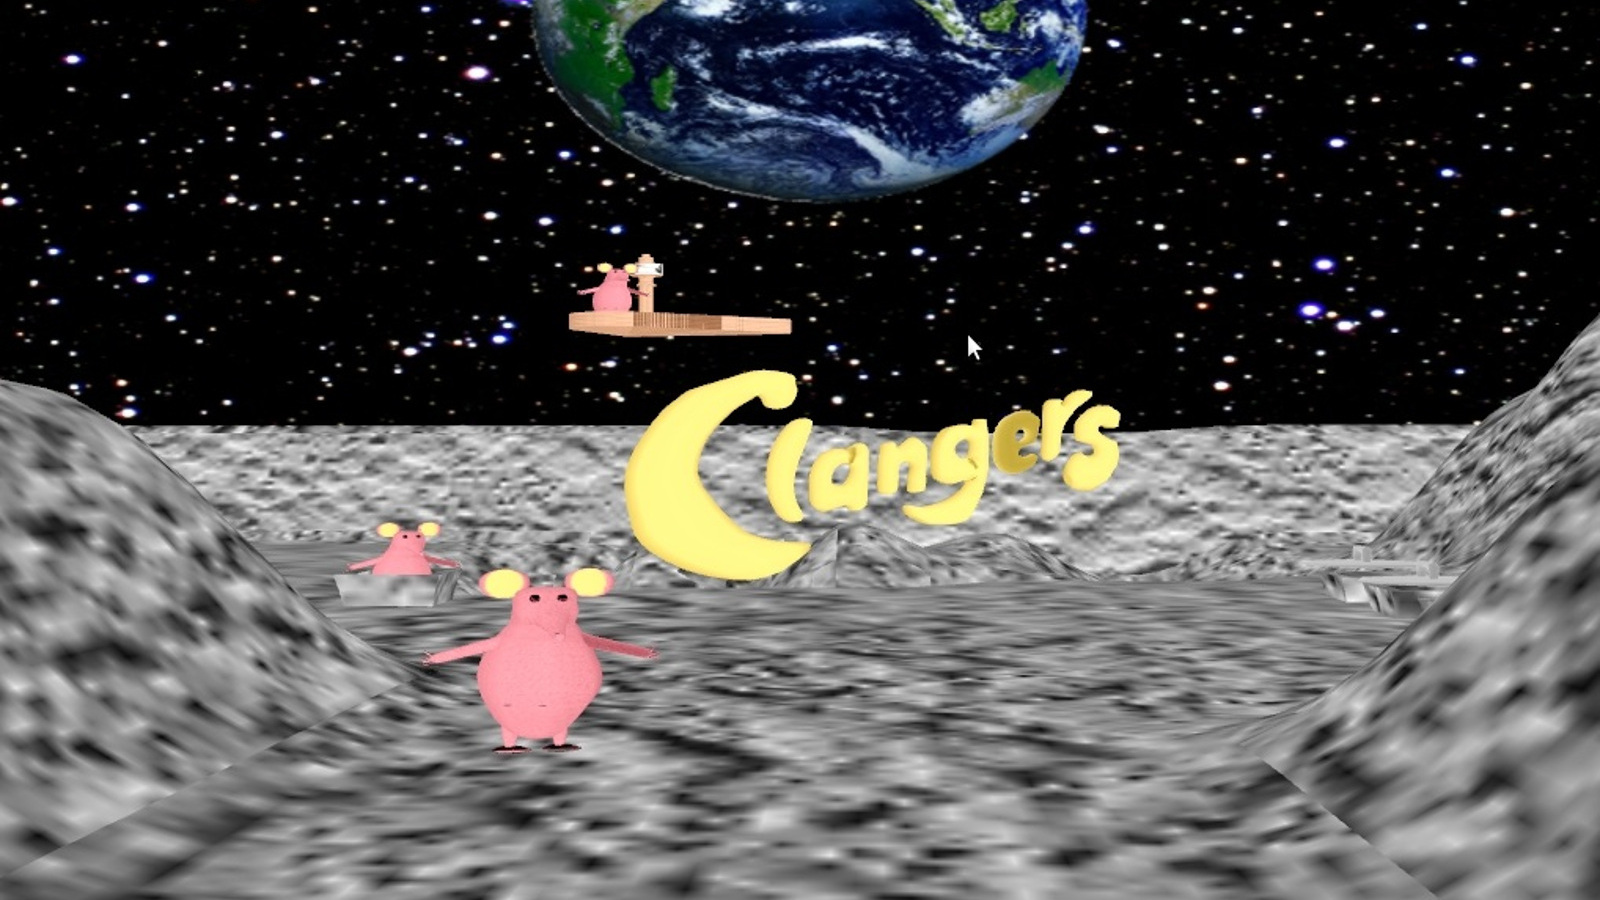
This application depicts a small world filled with Clangers, characters from the old BBC show. This application allows the user to explore the world which includes a few clangers as well as mountainous terrain on the moon while also providing an automatic tour of the main features. The models were created in Blender.
- date_rangeAugust 2015
- code GitHub
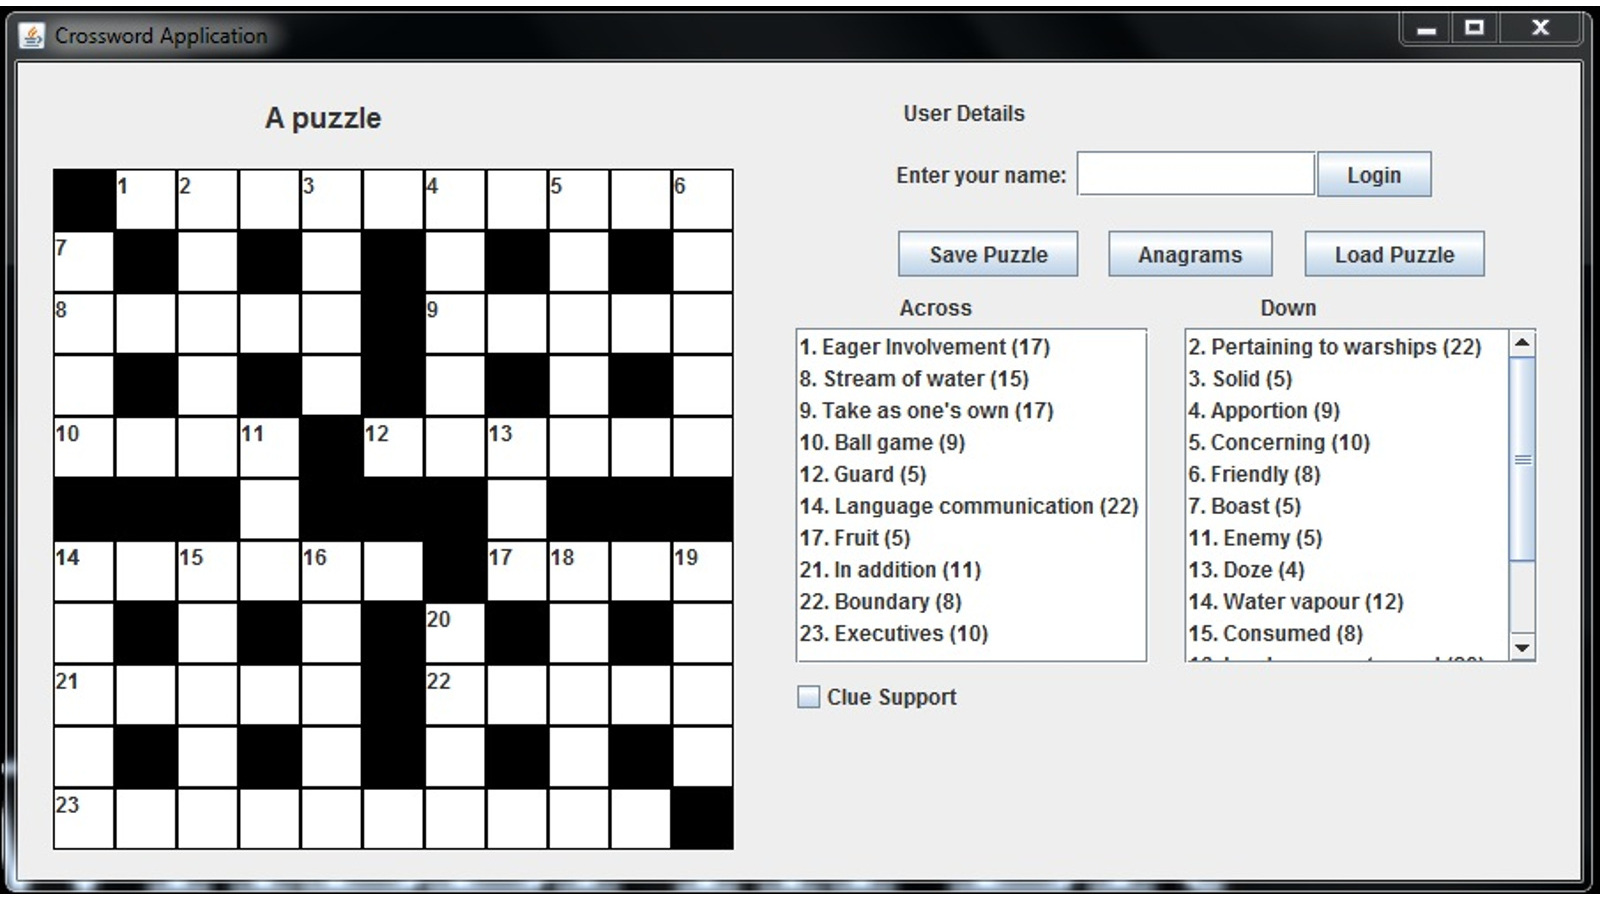
A straightforward crossword puzzle, allowing users to easily type across the boxes with their answers. The clues can be easily highlighted and there exists afunctionality to inform the users of which ones have been correctly filled. This application was made using Swing and AWT libraries.
- date_rangeAugust 2015
- code GitHub
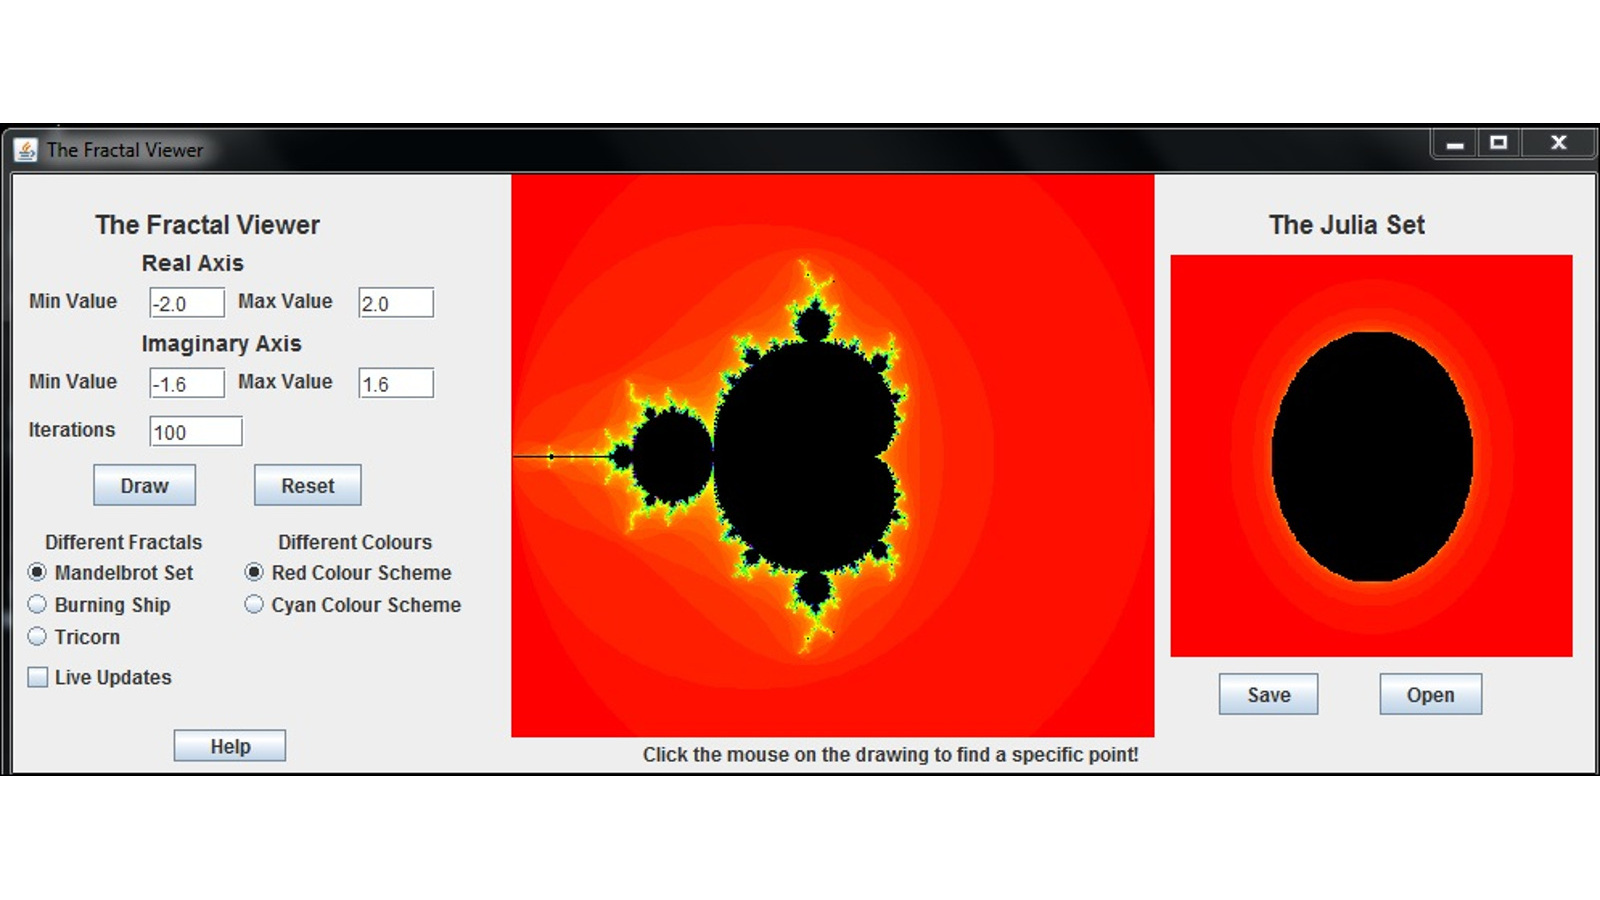
This application, created using the Swing and AWT libraries , displays a Mandelbrot set to the user and allows them to zoom into it as they wish. Users can also view the Julia set for a specific point on the Mandlebrot set and also save the image. The Mandlebrot set is available in three different calculation algorithms and two colour schemes.
Timeline timeline
Using d3.js, I have created a timeline of my time since university. On this visualisation, you can find my projects, education and experience, hovering over different data points for further information. Moreover, you can view a zoomed in version of any point of the timeline by using the navigation bar.


